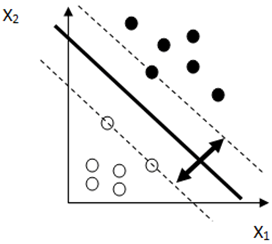
Given Figure Shows Some Data Points Classified By An Svm #356
Given figure shows some data points classified by an SVM classifier and the bold line on the center represents the optimal hyperplane. What the perpendicular distance between the two dashed lines represented by a double arrow line known as?<br /> <img src="@root_url/public/uploads/org/vu/mcqs/43043-image-title.png">
 This multiple choice question (MCQ) is related to the book/course
gs gs126 Neural Networks.
It can also be found in
gs gs126 Support Vector Machines - Large Margin Intuition - Quiz No.1.
Similar question(s) are as followings:
Online Quizzes of gs126 Neural Networks

Decision Trees - Decision Trees – Inductive Bias - Quiz No.1
gs gs126 Neural Networks
Online Quizzes

Support Vector Machines - Large Margin Intuition - Quiz No.1
gs gs126 Neural Networks
Online Quizzes


